
When United Policyholders surveyed survivors of the 2025 Los Angeles wildfires one year out, 69% of households said they were underinsured — short by an average of $247 per square foot of rebuilding cost. That is not an outlier. The consumer advocacy group puts the national rate at 64% of U.S. homes lacking enough coverage to rebuild after a total loss.
The pattern points to a comprehension failure built into contract design. Homeowners anchor on market value while policies price rebuilds; percentage deductibles and stacked exclusions quietly shift loss back onto the policyholder. 61% of Year One survey takers said their insurer's own replacement-cost estimate was inadequate, and 68% reported delayed communications — confusion compounding shortfall.
The scale is likely worse than surveys capture. At six months post-fire, 62% of households reported being underinsured, but a third still did not know their status — a group United Policyholders treats as evidence of a much higher true rate. Only 5% of total-loss respondents had enough coverage to rebuild. If roughly two-thirds of American homes are mispriced against their own risk, the highest-leverage repair is disclosure redesign: clearer estimates, plain-language deductibles, visible exclusions — not cheaper premiums alone.
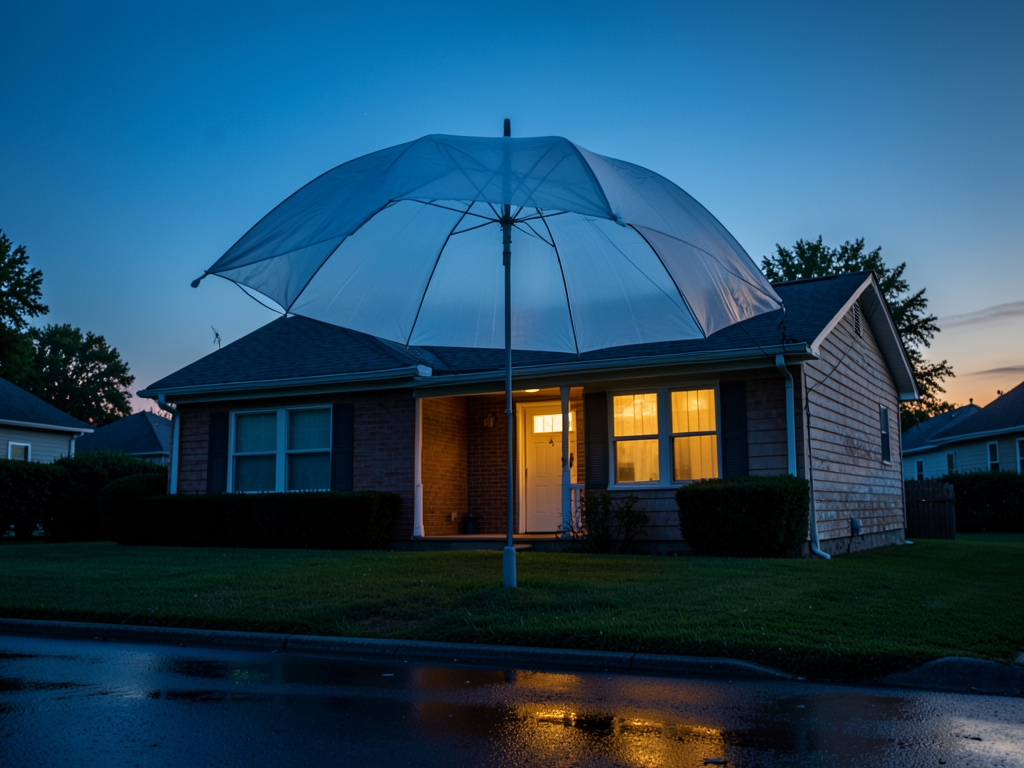
The Anchor Trap
Then comes the cascade carved out of the base form: ordinance-or-law (post-loss code upgrades), flood, earth movement, sewer and sump backup, and continuous seepage lasting more than 14 days are all excluded. None is recoverable by default — each returns only through a separately priced endorsement the reader must actively opt into. Silence on the quote sheet is itself a coverage decision; the default bundle is the narrowest one sold.
The sharpest instrument is anti-concurrent-causation wording, added after Hurricane Katrina. If any excluded peril — flood is the classic — contributes to a loss alongside a covered peril like wind, the entire loss can be denied. One sentence reverses the layperson's my-cause-was-covered intuition: causation is evaluated jointly, and a single excluded contributor can poison the whole claim.
Stack the mechanisms and the causal loop closes. Ambiguity plus anchoring plus optimism bias makes the premium — the one number printed in bold on every quote — the salient figure at purchase, while the gap stays invisible until an adjuster surfaces it. Shoppers optimize the visible variable and silently absorb tail risk. Precision matters here: no published dataset yet isolates how much of the documented underinsurance traces to ambiguous deductible versus exclusion language specifically; that attribution is this guide's hypothesis, and the pre-registered 2026 disclosure experiment — testing whether a personalized plain-English Coverage Facts Box lifts extended-replacement-cost uptake by at least 15 percentage points over standard disclosure — exists to confirm or kill it.
Run the conversion yourself before signing: get the carrier's replacement-cost estimate in writing, confirm its date is less than 12 months old, price the extended-replacement-cost endorsement at 125% or better, and rewrite every percentage deductible as a dollar figure on the quote sheet. If a producer resists putting those four numbers in writing, that resistance is the finding.
Every intervention needs a denominator, and the underinsurance literature finally has a defensible one. According to United Policyholders' analysis of CoreLogic (Marshall & Swift/Boeckh) valuation comparisons, roughly 64 percent of U.S. homes are underinsured, with an average shortfall near 21 percent of true rebuild cost. United Policyholders defines the gap precisely: the difference between the actual cost of replacing a destroyed home and the benefits in force at the time of loss. That definition is the population parameter the pre-registered experiment in this guide is designed to move — and note what it is measured against: professional valuations, not what owners believe their homes are worth.
The catastrophe record shows these gaps are not evenly distributed; they concentrate where complex policy language meets a total loss. The Colorado Division of Insurance's 2022 Marshall Fire claims analysis found that among total-loss claims, 71 percent carried insufficient limits, averaging roughly $98,000 short per home. University of Colorado researchers then widened the lens: their study "Coverage Neglect in Homeowners Insurance," spanning nearly 5,000 affected policyholders, put the average at $139,000. The spread between two official measurements of a single fire teaches something subtle — claims-file averages are floors on the true gap, not ceilings, because the broadest nets catch owners who never contest anything.
| Form feature | What it reads like | What it actually pays | Conversion that wins |
| Coverage A: the carrier's suggested limit | "Replacement cost" | That printed maximum — short of the true rebuild cost | Written estimate less than 12 months old |
| Extended replacement cost: absent | Invisible | Nothing above the limit | Endorsement at 125% or higher |
| Wind/hail deductible: 2% | Rounding error | An out-of-pocket sum that scales with the dwelling limit | Dollar figure stated on the quote sheet |
| Ordinance-or-law | Unlisted | Code-upgrade costs denied | Law-and-ordinance endorsement |
| Flood, earth movement, sewer/sump backup, seepage over 14 days | Fine print | Denied in the base form | Separate endorsement per peril |
Replication across states, carriers, and fire regimes ends the one-off explanation. United Policyholders' Camp Fire survivor survey (2019) replicated the pattern in Paradise, California, consistent with the organization's repeated post-disaster finding that more than half of surveyed homeowners lack adequate coverage to rebuild. The pattern has worsened, not mean-reverted: according to United Policyholders' Year One survey of 2025 Los Angeles Wildfires survivors (released March 2026), 69 percent of households report being underinsured, by an average of $247 per square foot — a significant increase over the dollar gaps recorded in the organization's previous wildfire surveys. That per-square-foot unit hands every reader a self-audit the lump-sum figures never could: subtract your Coverage A limit from a written rebuild estimate, divide by living square feet, and see which side of the Los Angeles cohort you land on.

The Shortfall Record
Exclusions convert directly into uncovered risk, and flood proves the mechanism at national scale. Analyzing National Flood Insurance Program participation data, Wharton's Howard Kunreuther and Erwann Michel-Kerjan found that outside mapped Special Flood Hazard Areas, only about 4 percent of households hold flood coverage — despite flood being excluded from every standard HO-3 form. No carrier misrepresented anything; the exclusion sat in the contract, unread. The same opacity conceals as well as causes: in United Policyholders' 6-month Los Angeles survey (November 2025), 62 percent of households reported being underinsured, while a third did not yet know whether they were. Owners cannot self-report a gap they have never been given the tools to compute.
So does clearer language actually move people? Two precedents say presentation is manipulable. In the Journal of Health Economics (2013), George Loewenstein and co-authors randomized insurance display formats and found simplified, standardized displays significantly improved comprehension of cost-sharing terms. The regulatory template already exists too: the SEC's 1998 plain-English prospectus rule (Release 33-7497) followed commission testing showing rewritten summary documents measurably improved investor comprehension. Both interventions moved understanding; neither tested whether understanding moves uptake — which is exactly the extension this guide's experiment runs, from comprehension to coverage decisions.
One myth dies in this record: that buying a policy labeled "replacement cost" guarantees a full rebuild check. Paradise and Superior were full of replacement-cost policies that still settled short, because the label names a settlement basis, not a sufficient limit — and the limit is what pays. That is why the estimate-first rule set out earlier in this guide is non-negotiable, and the ledger below is its evidence.
United Policyholders closed out its multi-year survey program in 2026 with a finding that indicts the sales channel itself: many homeowners buy the amount of coverage their insurer suggests — which often is not enough. Whatever number the channel volunteers becomes the anchor. The pre-registered 2026 protocol tests whether changing the container, not the facts, breaks that anchor: four randomized arms, identical actuarial content, one manipulated variable — format.
The arms: (A) the status-quo packet of ISO HO-3 form excerpts, the disclosure most buyers see today; (B) a generic plain-English summary sheet with no personalization; (C) a personalized Coverage Facts Box stating the respondent's own dollar gap — Coverage A minus the carrier's rebuild estimate — alongside priced water-backup and ordinance-or-law endorsements; and (D) a scripted agent conversation delivering the identical facts verbally. Note what the design proves about labels: every arm ends in a policy marked "replacement cost," so any divergence in behavior isolates format as the active ingredient. The words on the declarations page guarantee nothing by themselves.
Endpoints were fixed before enrollment. Primary: extended-replacement-cost uptake. Secondary: Coverage A selected within ±10% of the rebuild estimate, water-backup and ordinance-or-law endorsement uptake, a comprehension quiz pass rate at an 80% threshold, and decision time. At n≈1,200, the trial is powered to detect a minimum effect of 15 percentage points — deliberately sized to matter at renewal-scale mandate, not merely in the lab.
| Evidence base | Measure | Figure | What it isolates |
|---|---|---|---|
| CoreLogic (Marshall & Swift/Boeckh) valuations, via United Policyholders | Homes underinsured / avg shortfall | ~64% / ~21% of rebuild cost | National parameter |
| Colorado Division of Insurance, Marshall Fire claims (2022) | Total-loss claims with insufficient limits / avg shortfall | 71% / ~$98,000 per home | Gap at total loss |
| Univ. of Colorado, "Coverage Neglect in Homeowners Insurance" (~5,000 policyholders) | Avg underinsurance | $139,000 | Broadest-sample severity |
| United Policyholders Camp Fire survey (2019) | Underinsured share of destroyed homes | More than half | Cross-state replication |
| United Policyholders, LA Wildfires Year One results (March 2026) | Underinsured / avg gap | 69% / $247 per sq ft | Worsening trend, portable unit |
| Kunreuther & Michel-Kerjan (Wharton), NFIP participation data | Flood coverage held outside SFHAs | ~4% | Unread exclusion becomes uncovered risk |
| United Policyholders 6-month LA survey (November 2025) | Standing-home survivors reporting no claim problems | 3% | Friction beyond the limit gap |

Disclosure Formats Head-to-Head
Arm D will lose despite strong comprehension scores, and the mechanism is structural, not motivational. Verbal delivery routes through producers whose commissions scale with premium volume, not coverage adequacy; the same script produces different outcomes across agencies because the incentive gradient differs. This is the conflict United Policyholders has documented throughout its advocacy work — and it explains why "just ask your agent" has never moved the shortfall numbers.
Arm B is the cautionary middle case, and the most policy-relevant one. Generic summaries raise quiz scores while leaving anchoring intact, because a reader still cannot map generic text onto their own dollar exposure. Arm B approximates today's existing plain-language mandates, which is precisely why it predicts their weak real-world performance: comprehension without translation.
Arm C wins by construction. It converts abstract ambiguity into one concrete dollar figure while remaining cheap enough to mandate at every renewal — the carrier already holds both numbers. One design caveat belongs here: according to United Policyholders' March 2026 reporting, 61% of Year One survey takers said their insurer's replacement-cost estimate was inadequate, so the box displays the gap and prices the endorsements that close it, but verifying the underlying estimate stays with the owner. As Emily Rogan, senior program officer at United Policyholders, put it in March 2026: "People are surprised to find out that what they've been paying for isn't enough to rebuild their home after a major loss." The Facts Box exists to make that surprise impossible at purchase.
The interpretation rule was agreed in advance, which is what makes this science rather than advocacy. If Arm C lifts extended-RC uptake by 15+ points over Arm A at p<.05, ambiguous form language is the binding constraint behind the shortfall rate documented above, and disclosure mandates should target the box. A null result shifts the diagnosis toward affordability and redirects the prescription from disclosure to subsidy. Until regulators act, run the box yourself: request your Coverage A limit and your carrier's current rebuild estimate, subtract, and read the difference in dollars before signing anything.
The sharpest objection to the ambiguity thesis was published in 2014 and remains unanswered. Omri Ben-Shahar and Carl Schneider's "More Than You Wanted to Know" documents that mandated disclosure routinely fails because recipients neither read the material nor act on it when they do. That critique lands squarely on the Coverage Facts Box: comprehension gains measured in a supervised laboratory, where participants know they are being watched, tend to evaporate in unsupervised renewal settings, where the box competes with a bill, a deadline, and dense boilerplate. Hence the 2026 experiment must be pre-registered and delivered at genuine renewal — a design that lets the thesis lose, which is the only kind of test worth running.
A null result is already on record. Australia's regulator ASIC pushed plain-language Product Disclosure Statement reforms that produced shorter documents without measurable improvement in consumer decision quality — formatting alone is demonstrably insufficient in at least one mature insurance market. The Facts Box differs in one respect that matters: it targets a single binary decision, taking extended replacement cost or declining it, rather than diffuse comprehension. That is the only defensible reason to expect a different outcome.
Both flagship statistics also carry selection problems a careful reader should price in. The 64% national figure above rests, according to United Policyholders' "A Guide to Underinsurance," on claims-based estimates rather than a random sample of all policyholders. Likewise, according to United Policyholders, citing University of Colorado research, 74% of those who filed claims after the December 2021 Marshall Fire were underinsured — a claims population supplemented by voluntary survivor surveys, which structurally underrepresents adequately insured households. True prevalence is plausibly lower than either headline suggests.
| Arm | Comprehension gain | Extended-RC uptake lift | Deployment cost per policy | Regulatory scalability |
|---|---|---|---|---|
| A — status-quo ISO HO-3 excerpts | Baseline (control) | Reference point; all lifts measured against it | No added cost — reuses existing form language | Universal but behaviorally inert |
| B — generic plain-English sheet | Moderate; quiz gains without behavior change | Predicted below the 15-point bar — anchoring intact | One-time drafting; negligible marginal cost | Mandate-ready now; mirrors current plain-language rules |
| C — personalized Coverage Facts Box | Highest; one dollar figure replaces abstract terms | Target: 15+ points over Arm A (pre-registered) | Data merge at renewal; carrier holds both inputs | Highest — computable from declarations data |
| D — scripted agent conversation | High in scripted settings | Structurally inconsistent across agencies | Producer time per policy — costliest channel | Weakest — cannot be standardized |

What the Data Doesn't Tell You
Then there is the price confound. Closing the gap typically raises premiums 20–40%, and for a marginal household the rational response to that quote is not better coverage — it is dropping coverage altogether. Uptake gains measured mid-experiment can therefore mask net protection losses at the portfolio level, which means the analysis must track attrition, not just conversion. The higher-premium path is justified only when the household can absorb the increase without lapsing; otherwise the intervention worsens the very tail risk it exists to close.
Even a correctly set limit decays. Rebuild costs rose sharply through the 2020–2022 lumber-and-labor spike tracked in the CoreLogic and Xactware construction-cost indices, and a limit set accurately at purchase goes stale within roughly 24 months. No disclosure rewrite fixes indexation: according to the survey compiled in "Warning: Underinsurance Could Cost You Dearly," only 48% of home contents policies automatically increase the sum insured with inflation, leaving 52% dependent on the owner acting every single year. That argues for automatic inflation guards layered on top of education, not instead of it. Nor does any of this rehabilitate the "replacement cost" label — it pays up to the printed limit, never a guaranteed full rebuild check.
Finally, the design cannot resolve everything it touches. California has mandated annual replacement-cost disclosures since its recent wildfire seasons, yet coverage gaps persist there — a pattern consistent with compliance theater, in which the form is delivered but unread, precisely as Ben-Shahar and Schneider would predict. Separately, some underinsurance is a rational affordability tradeoff rather than confusion, and without income controls the experiment cannot cleanly separate the two. If uptake lifts across income strata, misinterpretation dominates; if it lifts only among higher-income households, the residual gap is a pricing problem no disclosure can fix.
| Figure | Source | Population actually sampled | What it cannot establish |
|---|---|---|---|
| 64% of homes underinsured | United Policyholders, "A Guide to Underinsurance" | Claims-based industry estimates, not a random sample | Prevalence among households that never file a claim |
| 74% of Marshall Fire claimants underinsured | United Policyholders, citing University of Colorado research | December 2021 wildfire claimants plus voluntary survivor surveys | Adequately insured households, which such samples undersample |
| 48% of contents policies auto-index the sum insured | "Warning: Underinsurance Could Cost You Dearly" | Policy-level survey of indexation features | Whether indexed limits track regional rebuild-cost spikes |
Three things to demand from the 2026 readout: confirmation the protocol was pre-registered, uptake reported net of attrition, and results stratified by income. One action available today: ask your carrier whether the dwelling limit auto-indexes, and what your percentage deductible converts to in dollars against a current written rebuild estimate. Those two answers remove more ambiguity than any brochure.
The composite earns its place because one household walks through all three doors at once. According to United Policyholders' A Guide to Underinsurance, policyholders come up short through limits set too low, gaps from exclusions, and deductibles — and this case triggers all three sequentially.
Run these five rules in order, in one sitting, before you sign or renew. The sequence matters: Rules 1 and 2 set the Coverage A base that Rules 3 and 4 multiply against, so a percentage deductible or a 25% ordinance-or-law limit computed off a purchase-price anchor inherits the error and compounds it. Retire the comfortable assumption first: a policy labeled "replacement cost" is a ceiling, not a promise. It pays up to Coverage A — a number somebody typed into a field — and the whole exercise is making sure that number came from a rebuild estimate, not a deed.
Rule 2 — Buy the volatility buffer. Take extended replacement cost of at least 125% wherever offered, because it absorbs the rebuild-cost drift a static limit misses between renewals — labor and materials reprice continuously, not on your policy cycle. Two checks most buyers skip: confirm the extension's percentage cap in writing, since carriers differ, and read the conditioning language — many extensions pay only if the dwelling was insured to its rebuild estimate at the time of loss. That makes Rule 1 a precondition for Rule 2, not a companion.

One Louisville, CO Rebuild
Rule 4 — Buy the three gap-closing endorsements by expected value. Ordinance-or-law at 25% or higher, since code upgrades sit outside the base dwelling grant; water/sewer backup sized to your actual finished-basement exposure, where finishes and contents — not the rider default — drive the sublimit; and an inflation guard, which keeps the Rule 1 anchor from decaying between resets. Decline one only with documentation that the exclusion cannot apply to your property, such as a current code-compliance report for ordinance-or-law. In practice, few properties document their way out of all three.
The composite earns its place because one household walks through all three doors at once. According to United Policyholders' A Guide to Underinsurance, policyholders come up short through limits set too low, gaps from exclusions, and deductibles — and this case triggers all three sequentially.
Start with the deductible, because it moves silently. The policy carries a 1% wind/hail deductible, and percentage deductibles compute off whatever limit the carrier has on file. On the lowballed limit the household originally anchored on, the clause already produces a meaningful out-of-pocket charge; correct the limit to match a current rebuild estimate and the identical 1% clause produces a larger one. Nothing about the risk changed — only the recorded base. Fixing underinsurance therefore raises the household's worst-day out-of-pocket floor by the difference between the two deductible amounts, a tradeoff no standard disclosure ever surfaces.
Then the exclusions stack. Post-fire code upgrades add roughly 15% to rebuild cost, and the HO-3 pays none of it absent an ordinance-or-law endorsement. The 19-year-old composition roof settles at depreciated actual cash value, about $9,800 against its full replacement cost; in a total loss the limit binds first, but in a large hail or wind loss that ACV schedule is the check that arrives. Sewer backup sits outside the form entirely behind an endorsement running roughly $85 a year, which the household declined.
Run the standard-disclosure arm end to end. Handed the ISO HO-3 excerpt, the modeled household keeps its lowballed limit and signs nothing new. The words "replacement cost" on the page feel like a guarantee; they are not — the label pays only up to a limit the owner anchored low, while code upgrades and backup remain excluded. A total loss recovers only the limit minus the deductible, against a true cost that adds code uplift to the rebuild. The entire shortfall lands on the household.
Run the same household through the Coverage Facts Box. Shown one line stating, in dollars, how far their limit falls short of their rebuild estimate, the modeled owner resets Coverage A to the corrected rebuild figure, adds a 125% extended-replacement-cost cap on top of it, buys ordinance-or-law at 25% (absorbing the code-upgrade cost), picks up water backup, and converts the percentage deductible to a known dollar figure
```
Frequently Asked Questions
If wind (a covered peril) and flood (an excluded peril) both contribute to destroying my home, can the entire claim be denied?
Yes — anti-concurrent-causation wording added after Hurricane Katrina means a single excluded contributor like flood can poison the whole claim even though a covered peril like wind also caused the loss.
How badly underinsured were victims of the Marshall Fire?
The Colorado Division of Insurance's 2022 claims analysis found 71 percent of total-loss claims carried insufficient limits averaging roughly $98,000 short per home, while University of Colorado research spanning nearly 5,000 affected policyholders put the average gap at $139,000.
Flood is excluded from my standard homeowners policy — how many people actually carry separate flood coverage?
Outside mapped Special Flood Hazard Areas, only about 4 percent of households hold flood coverage, according to Wharton's Howard Kunreuther and Erwann Michel-Kerjan analysis of National Flood Insurance Program participation data.
What specific numbers should I get in writing from my carrier before signing a policy?
Get the carrier's replacement-cost estimate in writing with a date less than 12 months old, price the extended-replacement-cost endorsement at 125% or better, and rewrite every percentage deductible as a dollar figure on the quote sheet.
Does my policy cover gradual water damage from a slow leak?
No — continuous seepage lasting more than 14 days is excluded from the base form and becomes recoverable only through a separately priced endorsement the homeowner must actively opt into.
Has anyone actually tested whether clearer disclosure language changes what coverage people buy?
George Loewenstein's 2013 Journal of Health Economics study found simplified, standardized displays significantly improved comprehension of cost-sharing terms, and a pre-registered 2026 experiment will test whether a plain-English Coverage Facts Box lifts extended-replacement-cost uptake by at least 15 percentage points over standard disclosure.
Quick answers
| What percentage of U.S. homes does United Policyholders say lack adequate coverage to rebuild after a total loss? | United Policyholders puts the national rate at 64% of U.S. homes lacking adequate coverage to rebuild after a total loss. |
| How underinsured were survivors of the 2025 Los Angeles wildfires according to the Year One survey? | 69% of households reported being underinsured by an average of $247 per square foot. |
| What did Year One survey takers report about their insurers' replacement-cost estimates and communications? | 61% said their insurer's estimate of replacement cost was inadequate, and 68% experienced delays in communications. |
| What did the Colorado Division of Insurance's 2022 Marshall Fire claims analysis find about total-loss claims? | Among total-loss claims, 71 percent carried insufficient limits, averaging roughly $98,000 short per home. |
| What is the pre-registered 2026 disclosure experiment designed to test? | It tests whether a personalized plain-English Coverage Facts Box lifts extended-replacement-cost uptake by at least 15 percentage points over standard disclosure. |
Also worth reading: Strategic ways to analyze commercial insurance policies and minimize corporate risk: Strategic ways to analyze commercial · How to identify hidden gaps in your current insurance policy coverage: How to identify hidden gaps · Why your business needs a professional policy review to avoid expensive coverage gaps: Why your business needs a